Building an SGX profiler for Gramine
This blog post describes how I developed the SGX profiling mode for Gramine. Thanks to Dmitrii Kuvaiskii and Michał Kowalczyk for reviewing.
Gramine is a framework for running Linux applications under non-standard environments, currently with Intel SGX enclaves as the main use case. In the previous article, I described adding GDB support for Gramine. Today, I'll describe adding support for profiling.
Profilers allow analyzing program behavior, for instance by presenting statistics of time spent in a given function. In the context of Gramine, a profiler is a pretty useful tool: it's quite possible that using Gramine for an application will add some overhead, and using a profiler, we can find out its source.
(There might be different reasons for such overhead. For instance, Gramine might
implement a feature in an inefficient way, or not provide a feature at all,
causing the application to fall back to suboptimal behavior. The inefficiency
might also be due to the constraints of specific Gramine environment: for
instance, the fork operation under SGX is pretty much guaranteed be slower
than in native Linux. A profiler helps with understanding where exactly the
execution time is being spent.)
Unfortunately, similar to what we've seen with GDB, Gramine's SGX mode does not support profiling tools out of the box: by default, the code executing inside an SGX enclave is opaque to external tools.
When searching for a solution, I tried to adapt a standard tool (perf), and,
when that failed, to write my own profiler. In the end, I arrived at a hybrid
solution: Gramine gathers its own data about SGX enclave execution, but uses
perf for processing data and displaying statistics.
Using perf
perf is usually a pretty good choice for Linux profiling. It's a tool that is
partially built into the Linux kernel. By running perf record, we can ask
Linux to record a trace of program execution. Then, perf report will interpret
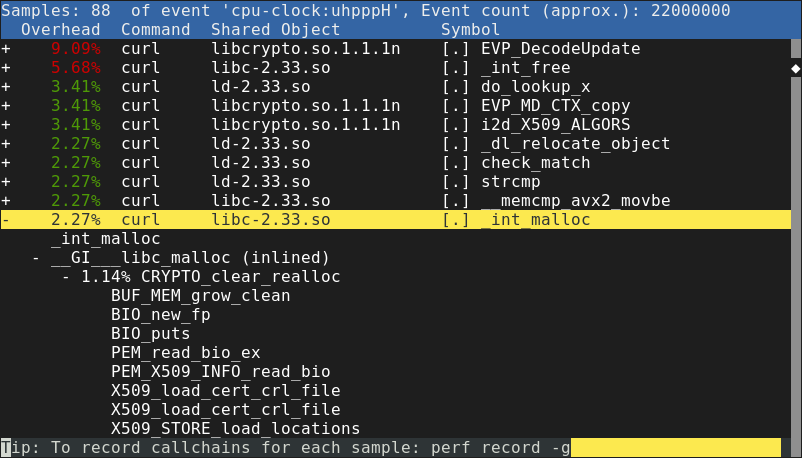
that data and show time spent in each function. Here is an example of a report
from perf:
The architecture of perf is interesting. In order to monitor a running
process, perf record asks the Linux kernel to collect events from it (using
the perf_event_open system call). The Linux kernel records samples, which
typically contain some execution state (instruction pointer, stack pointer,
etc.). Linux also records information about executable files (main binary and
shared libraries) mapped by the application.
This information is then forwarded to perf record, which saves it to a file
(usually called perf.data). Afterwards, that file can be opened by perf
report. While the samples contain only raw memory addresses, perf report is
able to convert them to function names by using the recorded information about
mapped executables. First, it converts the memory address to offset in the
executable file, then it analyzes the executable file to find out which function
the offset corresponds to (similar to how addr2line does it).

perf is a very powerful tool. Apart from the basic statistics shown above,
it's possible to gather information about kernel execution, detailed processor
performance (e.g. cache misses), system calls, and much more. (See Brendan
Gregg's perf page for various examples.)
In fact, when I ran Gramine in the direct (non-SGX) mode, perf already worked
out of the box! This might be surprising given the fact that Gramine loads
various binaries on its own: GDB needed some extra help figuring out where the
files are mapped, even in the direct mode. perf, however, figures that out by
recording mmap syscalls made by Gramine.
In SGX mode, however, things were not looking as good. It turns out that perf
will assign all time spent inside an SGX enclave to a function called
async_exit_pointer:
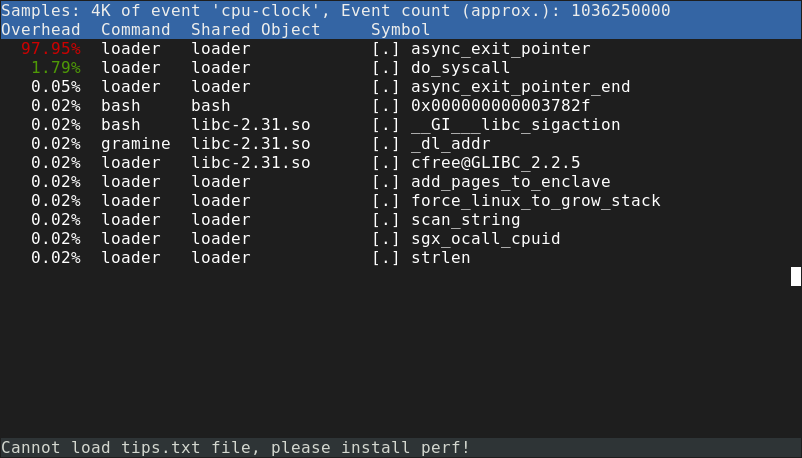
Note that in the screenshot, loader is the name of the main
Gramine binary.
As explained in the previous article about GDB, Async Exit Pointer (AEP)
is where the process ends up when enclave execution is interrupted. It turns out
that the same limitation applies to perf. In order for Linux to record a
sample, the process must be temporarily stopped first (usually, by a timer
interrupt).
This sounds pretty difficult to work around, since the samples are being
recorded by the Linux kernel, not by the user-space perf record tool. Unlike a
debugger, perf record does not stop the process, it just keeps receiving a
stream of events about it from the Linux kernel.
I decided to move away from perf for the time being, and look for other ways
to profile Gramine.
Poor man's profiler
A very simple method of profiling (if it can even be called that) is to use GDB: run the program, hit Ctrl-C a few times and display the backtrace. This is known as poor man's profiler. If there is an obvious performance issue, repeating that a few times should be enough to notice it. Given how Gramine already had good GDB support, I thought it was worth trying out.
However, it turns out that this method is useless for any kind of qualitative results: we will not notice whether some function takes 1%, 5% or 15% of the execution time. There have been attempts to turn "poor man's profiler" into a script that repeatedly asks GDB to stop the process and display backtrace, but such a script still has massive overhead. With Gramine running in SGX mode, it's difficult to take more than a few samples per second.
Writing my own profiler
Still, trying out the "poor man's profiler" gave me a better idea: why couldn't Gramine take the samples by itself? We already have the code running at the Async Exit Pointer (AEP) handler, and we know this handler executes at least once every 4 milliseconds (default Linux scheduler interval). What's more, thanks to the GDB integration, I already knew how to extract the instruction pointer value from the SGX enclave.
That was the first version of the SGX profiler: in the AEP handler, Gramine retrieved the instruction pointer value and recorded it in a hash map. Then, on process exit, it dumped the hash map of executed code addresses.
The addresses alone might not tell us much, but we actually know which code they correspond to. Thanks to the GDB integration, we maintain a list of loaded binaries, which we also can dump to a file. Then, determining the function name is a matter of using a right tool. I wrote a helper Python script that performed this conversion using pyelftools and displayed a report.

What about the stack trace?
One major limitation was that I had only information about the current
function, and not the function one level higher (not to mention the whole
stack). As a result, I could learn that a generic function like memset or
memcpy took most of the time, but not where it was called from.
Finding out the stack trace, or even reaching one level higher, is not trivial. When the code is compiled in debug mode, it might be as easy as reading the RBP value (frame pointer) to find the current stack frame. The stack frame should contain the return address as well as the next frame pointer, which we can follow further.
However, as the linked article mentions, stack frames on x86-64 Linux (AMD64 ABI) are actually optional. GCC omits them whenever optimizations are enabled. We might also be running some functions written in assembly that do not use a frame pointer. As a result, the RBP register, and values saved on stack, cannot always be trusted.
To salvage the situation, I experimented with some heuristics (e.g. is the next frame pointer properly aligned, and lower than the current frame, but not too low?) and stopping the stack trace whenever we suspect the value to be garbage. It still did not work very well.
The proper way of recovering the stack trace is recovering the DWARF (CFI) information from a binary, and interpreting the stack based on this information. This can be done using a library like libdwfl or libunwind, either from another process (e.g. a debugger), or from the process that wishes to examine itself, for example, to display a stack trace on crash.
My idea was to invoke one of these libraries inside the AEP handler, find out
the whole stack trace, and write it to a file. I got as far as adapting
libdwfl to compile with Gramine, but the code occasionally crashed in a way I
could not debug. I decided that this approach was another dead end: I was
running a lot of complicated code, coming from external library, in what should
be a simple event handler, and in an environment where we avoid using even
glibc.
How does perf do it?
At this point, I became curious: how does perf retrieve stack traces? The data
gathered by perf actually comes from the Linux kernel. Does that mean the
kernel parses all the binaries, and runs libdwfl or equivalent in order to
record the full stack trace? That sounds unlikely.
It turns out that perf record supports several modes for recording stack traces:
--call-graph=fp, FP (frame pointer mode): in this mode, the Linux kernel tries to follow the frame pointer (on x86-64, the RBP register), and record the frames. Unfortunately, as explained above, this works only if the compiled code uses frame pointers, which is not guaranteed.--call-graph=lbr: this uses Intel's Last Branch Records feature which stores a short stack trace in processor's registers. I haven't really tried out this mode.
--call-graph=dwarf: this indeed uses the DWARF information, but not from kernel. In this mode, the kernel takes a snapshot of all registers, and the stack (8 KB of memory above the current stack pointer) and inserts that in the sample. Then, the user-space tool (perf report) uses a DWARF library such aslibdwflin order to parse this information. Instead of digging through a live program's memory, we process snapshots of it, possibly long after the program exited.

The call-graph=dwarf mode looked like a promising approach. I could easily
record the same information: dump all registers, and 8 KB of stack memory,
inside the AEP handler. The hard part would be parsing all these snapshots using
DWARF information. Even with the right library, I was really not looking forward
to that.
But what if I could actually use the existing perf report tool?
Feeding data to perf report
Up until that time, I did not seriously consider using perf report instead of
my Python reporting script. I did briefly think about using a viewer such as
kcachegrind or even Google Chrome, but these tools expect
samples with already-parsed locations and stack traces.
perf report does parse raw data, but it expects input (the perf.data file)
in a complicated format produced by the Linux kernel. The amount of data
gathered by Linux was intimidating, and overall, perf.data sounded like a
"private" interface used by the perf system.
However, on closer look, it turned out that the perf.data format is pretty well documented. The file can contain many event types, but most parts are optional and can be omitted. I only needed to record a few pieces of information:
- for "simple" samples (no stack): instruction pointer value (
PERF_SAMPLE_IP), - for samples with stack: additionally, registers (
PERF_SAMPLE_REGS_USER) and stack snapshot (PERF_SAMPLE_STACK_USER), - additionally, an
mmapevent (PERF_RECORD_MMAP) whenever the application mapped a new executable file.
Additionally, it turned out that perf report expected a few more pieces of
information, such as processor architecture. I determined the exact details
using the following procedure: first, I recorded a very simple program using
perf record and disassembled the data file (using perf script -D). Then, I
created a program that wrote my own data file with similar events, and passed it
to perf report. Using trial and error, I determined the smallest set of data
that allowed perf report to run.
That was the final idea that allowed me to (at least partially) stop reinventing
the wheel. I still had custom code that recorded samples of a running SGX
application. However, for interpreting these samples, I could actually use the
report tool for perf. It not only saved me a lot of work involved in
processing the samples, but also gave me a lot of features for free: perf
allows exploring the data in various ways, such as annotating source code and
assembly for a function. Overall, it's a much more advanced tool than
I could hope to provide myself.
Putting it together
Here, then, is the SGX profiler I came up with:
During each AEX (asynchronous enclave exit) event, we call the sampling function just before returning to the enclave.
The sampling function (sgx_profile_sample_aex), after applying some rate limiting, retrieves the information about a thread (in-enclave registers and 8-kilobyte stack snapshot).
This information is converted to a perf.data format and periodically flushed to disk.
In a similar way, we also record all ELF binaries loaded in the enclave (sgx_profile_report_elf) and convert them to
PERF_RECORD_MMAPevents.The resulting file can be opened in
perf report, same as "real" files produced by Linux.
To enable the SGX profiling mode for yourself, see the SGX
profiling section in the Gramine documentation. In short, you
will need to compile Gramine in debug mode, and add some options to the
manifest. Then, running an application in Gramine will produce a file that can
be opened by perf report.
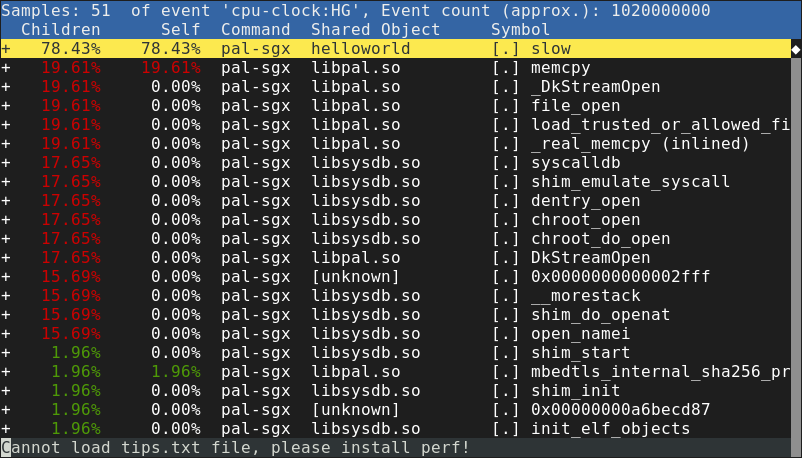
The above report shows functions executed inside the SGX enclave. The top
entry, slow, is a function that I added to the application: it
contains a long-running loop. Functions belonging to libpal.so and
libsysdb.so come from the two main components of Gramine: PAL and
LibOS, respectively.
The SGX profiler turned out to be pretty useful: it allowed us to track down
various problems that appeared only in SGX mode (and, as such, could not be
traced using "normal" perf).
One frequently encountered issue was applications mapping too much memory. On
Linux, mmap is usually cheap, so you can afford to map a large area without
using it: the actual memory for a page will be allocated only after the
application writes to it for the first time. However, in Gramine's SGX mode,
enclave memory is preallocated, and mmap returns existing
enclave pages. These pages have to be zeroed first, causing mmap to take more
time. It might be necessary to tweak some components of the application (such as
the glibc implementation of malloc) to avoid excessive
mmap use.
In conclusion
I'm pretty happy with the SGX profiling mode. Recording SGX execution samples by
myself was easier that I thought, and I think feeding that data to perf is a
nice hack. Of course, the whole project was also a great learning opportunity
for me.
However, I regret all of that was necessary, and I hope that a simpler solution
appears in the future. Perhaps perf will be able to work with SGX enclaves
directly.
Recently, the Gramine team shipped another feature that can be used for SGX
profiling: an integration with Intel VTune Profiler. While this feature
supplements, not replaces, the perf integration, VTune supports SGX natively,
so it's likely to be more accurate and produce more details.
GDB support inside Gramine's SGX enclaves
This is a blog post about GDB support in the Gramine project. This feature was originally written by Chia-Che Tsai, and later expanded by me (Paweł Marczewski) and other contributors to the project. Thanks to Michał Kowalczyk and Dmitrii Kuvaiskii for reviewing the post.
Gramine is a framework for running Linux applications under non-standard environments, such as Intel SGX. Intel SGX is a special processor feature that allows creating enclaves: execution environments that are isolated from the host system. When a program runs inside an SGX enclave, its execution state and memory cannot be changed or even viewed by other software running on the machine - even by the host operating system.
This is a pretty unusual situation: normally, an application might not trust the external world (for example remote hosts), but it still trusts the host OS when it comes to basic operations like saving data in files, or sending it between processes. However, in the case of SGX, we do not want the host to access (or modify) our data, so performing these operations will be more complicated than just asking the host OS.
To make sure the interactions with outside world are safe, Gramine itself acts
as an operating system, and intercepts requests (system calls) made by the
application. Handling these requests might ultimately involve talking to the
host OS, but with extra security precautions: for instance, read and write
operations might actually apply encryption on the fly, so that the data stored
on the host cannot be read without an encryption key.
The diagram below shows the architecture of Gramine. The application and Gramine are running inside an enclave. Gramine handles application's system calls. When necessary, it invokes the untrusted runtime, which runs outside of the enclave and is responsible for calling the host OS.

Gramine might not be a real OS kernel, but it's still a pretty complicated piece of software. It's really useful to have a debugger when developing Gramine and running programs under it. However, we're not exactly running a normal Linux program, and standard Linux tools won't work without extra effort. We managed to get GDB running, but it wasn't easy...
Looking inside the SGX enclave
As mentioned before, by design, there is no way to look "inside" an SGX enclave. If we're not currently executing enclave code, memory access will not work.
For debugging purposes, the rules can be relaxed somewhat. It's possible to run
an enclave with debugging features enabled, in which case Linux will allow us to
read the enclave memory. Direct memory access still won't work, but it will be
possible to use mechanisms such as the /proc/<pid>/mem special file. GDB uses
/proc/<pid>/mem, so it can access enclave memory without problems.
(To enable debugging features, the enclave must be created with a debug bit set,
and enclave threads must additionally set the DBGOPTIN flag. This enables
special CPU instructions (EDBGRD/EDBGWR) which the Linux kernel can use to
read and write enclave memory).
Unfortunately, it's not that easy to check which part of the program is being executed. Whenever the process is stopped while in enclave, the SGX hardware forces it to exit the enclave and land on the Async Exit Pointer (AEP). Most CPU registers are also reset to prevent data leaks. Therefore, when we examine a stopped process with GDB, we will never see the actual location in enclave, or any other useful information such as stack pointer.

However, if we're able to read the enclave memory (via the /proc/<pid>/mem
special file), we can actually find the previous position stored there, as well
as values of all the other registers.
This is actually more complicated than it sounds like, and requires some support from Gramine. SGX saves the register values for each thread inside its TCS (Thread Control Structure), and in order to read these values from another process, it has to know the TCS base address for a given thread. Gramine dumps this information (along with other necessary details about the enclave) to a global object stored at a predefined address in memory.
Now, we need to make sure GDB uses that information. GDB interacts with the
process using ptrace. This is a Linux mechanism that allows, among other
things, starting and stopping another process, and reading register values while
it's stopped. Unfortunately, this is not useful if the process was stopped while
in enclave: as mentioned before, stopping the process causes it to temporarily
exit from enclave, so ptrace is not going to report the right location.
What we can do is intercept that mechanism: we use the LD_PRELOAD
trick to inject our own wrapper for ptrace.
Using this wrapper, we can ensure that GDB sees the right register values.
Whenever we find the process stopped at the AEP, we read the "real" instruction
pointer and other registers through /proc/<pid>/mem, and return this
information to GDB. Effectively, we pretend that the process was actually
stopped before it exited the enclave.

As a result, the enclave code is largely transparent to GDB: we're able to see the current location in enclave, single-step through instructions, and add breakpoints.
File information
Thanks to our ptrace wrapper, GDB knows what instructions are being executed.
However, it only sees them as raw machine code: there is nothing that says which
source lines (or even functions) these instructions correspond to. This is
because GDB has no information about binaries that are loaded inside the
enclave.

This situation is actually not that different from regular Linux programs that use dynamic libraries. And regular programs have a standard solution for it: the GNU C library (glibc) maintains a special structure (r_debug) with a list of currently loaded shared libraries, and GDB reads this list.
It's tempting to try using this mechanism. However, r_debug is already
maintained by glibc in the untrusted runtime (outside of enclave), and while we
could probably write to it, interfering with data maintained by glibc sounds
like a bad idea. And creating another r_debug (either in enclave, or outside)
wouldn't really work, since GDB only expects one such variable.
Instead, we implemented a similar solution ourselves: Gramine maintains its own
debug_map structure describing currently loaded binaries, and on
each change, calls a function called debug_map_update_debugger(). This function is a no-op, and exists only so that
our Python extension for GDB can set a breakpoint in it, and
read debug_map whenever the breakpoint is triggered.
Determining what files to add to debug_map is not that simple: we can easily
register binaries loaded by Gramine, but Gramine is not the only component that
loads them. Much like Linux, when Gramine executes a dynamically linked binary,
it loads only the binary itself and its ELF interpreter (usually a dynamic
linker called ld-linux*.so). Then, the dynamic linker loads all other
libraries required by the application. In addition, the application itself could
use dlopen to load more libraries at run time.
Fortunately, both the dynamic linker and dlopen are usually provided as part
of the libc library. Gramine provides a patched version of glibc that calls
gramine_register_library() whenever it loads a new dynamic
library, and as a result is able to notify GDB whenever a new library is added.
Having a list of all loaded binaries also turned out to be useful for other developer features: thanks to it, Gramine can report more details about a crash location, and even help with profiling.
Stack jumping
As said before, Gramine runs as a library, but handles operations that would
normally be system calls. This is also achieved using our patched version of the
glibc library: instead of running a SYSCALL instruction, the library jumps
directly into Gramine. (The application might also execute
SYSCALL instructions directly, and we intercept these, but this is much slower
than a simple jump).
What's important is that we cannot keep using the application's stack. Normally,
the SYSCALL instruction triggers entering the kernel (which sets up its own
stack), and the code containing SYSCALL relies on the fact that the
application's stack stays untouched. Therefore, Gramine also needs to switch to
its own stack.
Deeper layers of Gramine actually switch stacks for the second time: when Gramine needs to run some code outside of the SGX enclave, it uses another syscall-like mechanism called OCALL ("outside call"). The code after OCALL cannot access the enclave memory anymore, so it needs its own stack in untrusted (non-enclave) memory.
As a result, if we want to read a full stack trace, we might need to go through three different places in memory: the untrusted stack, Gramine's stack, and finally the application stack.

GDB has to understand how to move between all these stacks. This is usually done
by decorating the assembly code with CFI directives, which contain exactly
this information (e.g. "in this place in the code, the previous stack frame is
saved at address [RSP+xyz]").
However, notice that in our case, the stack frames are not ordered: most of the
time the next stack frame is at a lower address (as is normal on x86), but when
we change stacks, we might need to jump back to a higher address. It turns out
that GDB really doesn't like this situation, and claims the stack is corrupt.
The only exception is when a function is called __morestack (this magic name
is actually hardcoded in GDB sources). In order for GDB to
process our stack trace correctly, we have to pretend that the return address
is inside a __morestack function.
In conclusion
Unfortunately, getting GDB to work with Gramine required some fighting. I mentioned the most important parts, but I left out some more details, such as signal handling or handling multiple threads. The end result is usable for most scenarios, but still breaks occasionally.
Of course, we're not interfacing with GDB using any official API. An alternative implementation could use GDB's libthread_db mechanism, or perhaps the remote debugging protocol. I think both of these are worth at least investigating.
Contact us at :
Report them at :